<onWebFocus />
Knowledge is only real when shared.
Debugging
September 27, 2021
How to improve your debugging skills.
Debugging enters the picture when you code something and try it out, but it's not doing what you expect it to do. In that sense debugging is the art of finding and correcting incorrect code.
Techniques
There aren't many debugging techniques. The oldest and still most popular one is to add console.log statements in critical parts of the application. After running the code the logs are analyzed to see where they don't match expectations.
Another one is to add debugger statements which open the developer tools in the browser when this line of code is executed. Similar to breakpoints for other programming languages and environments you can then step through the code line-by-line.
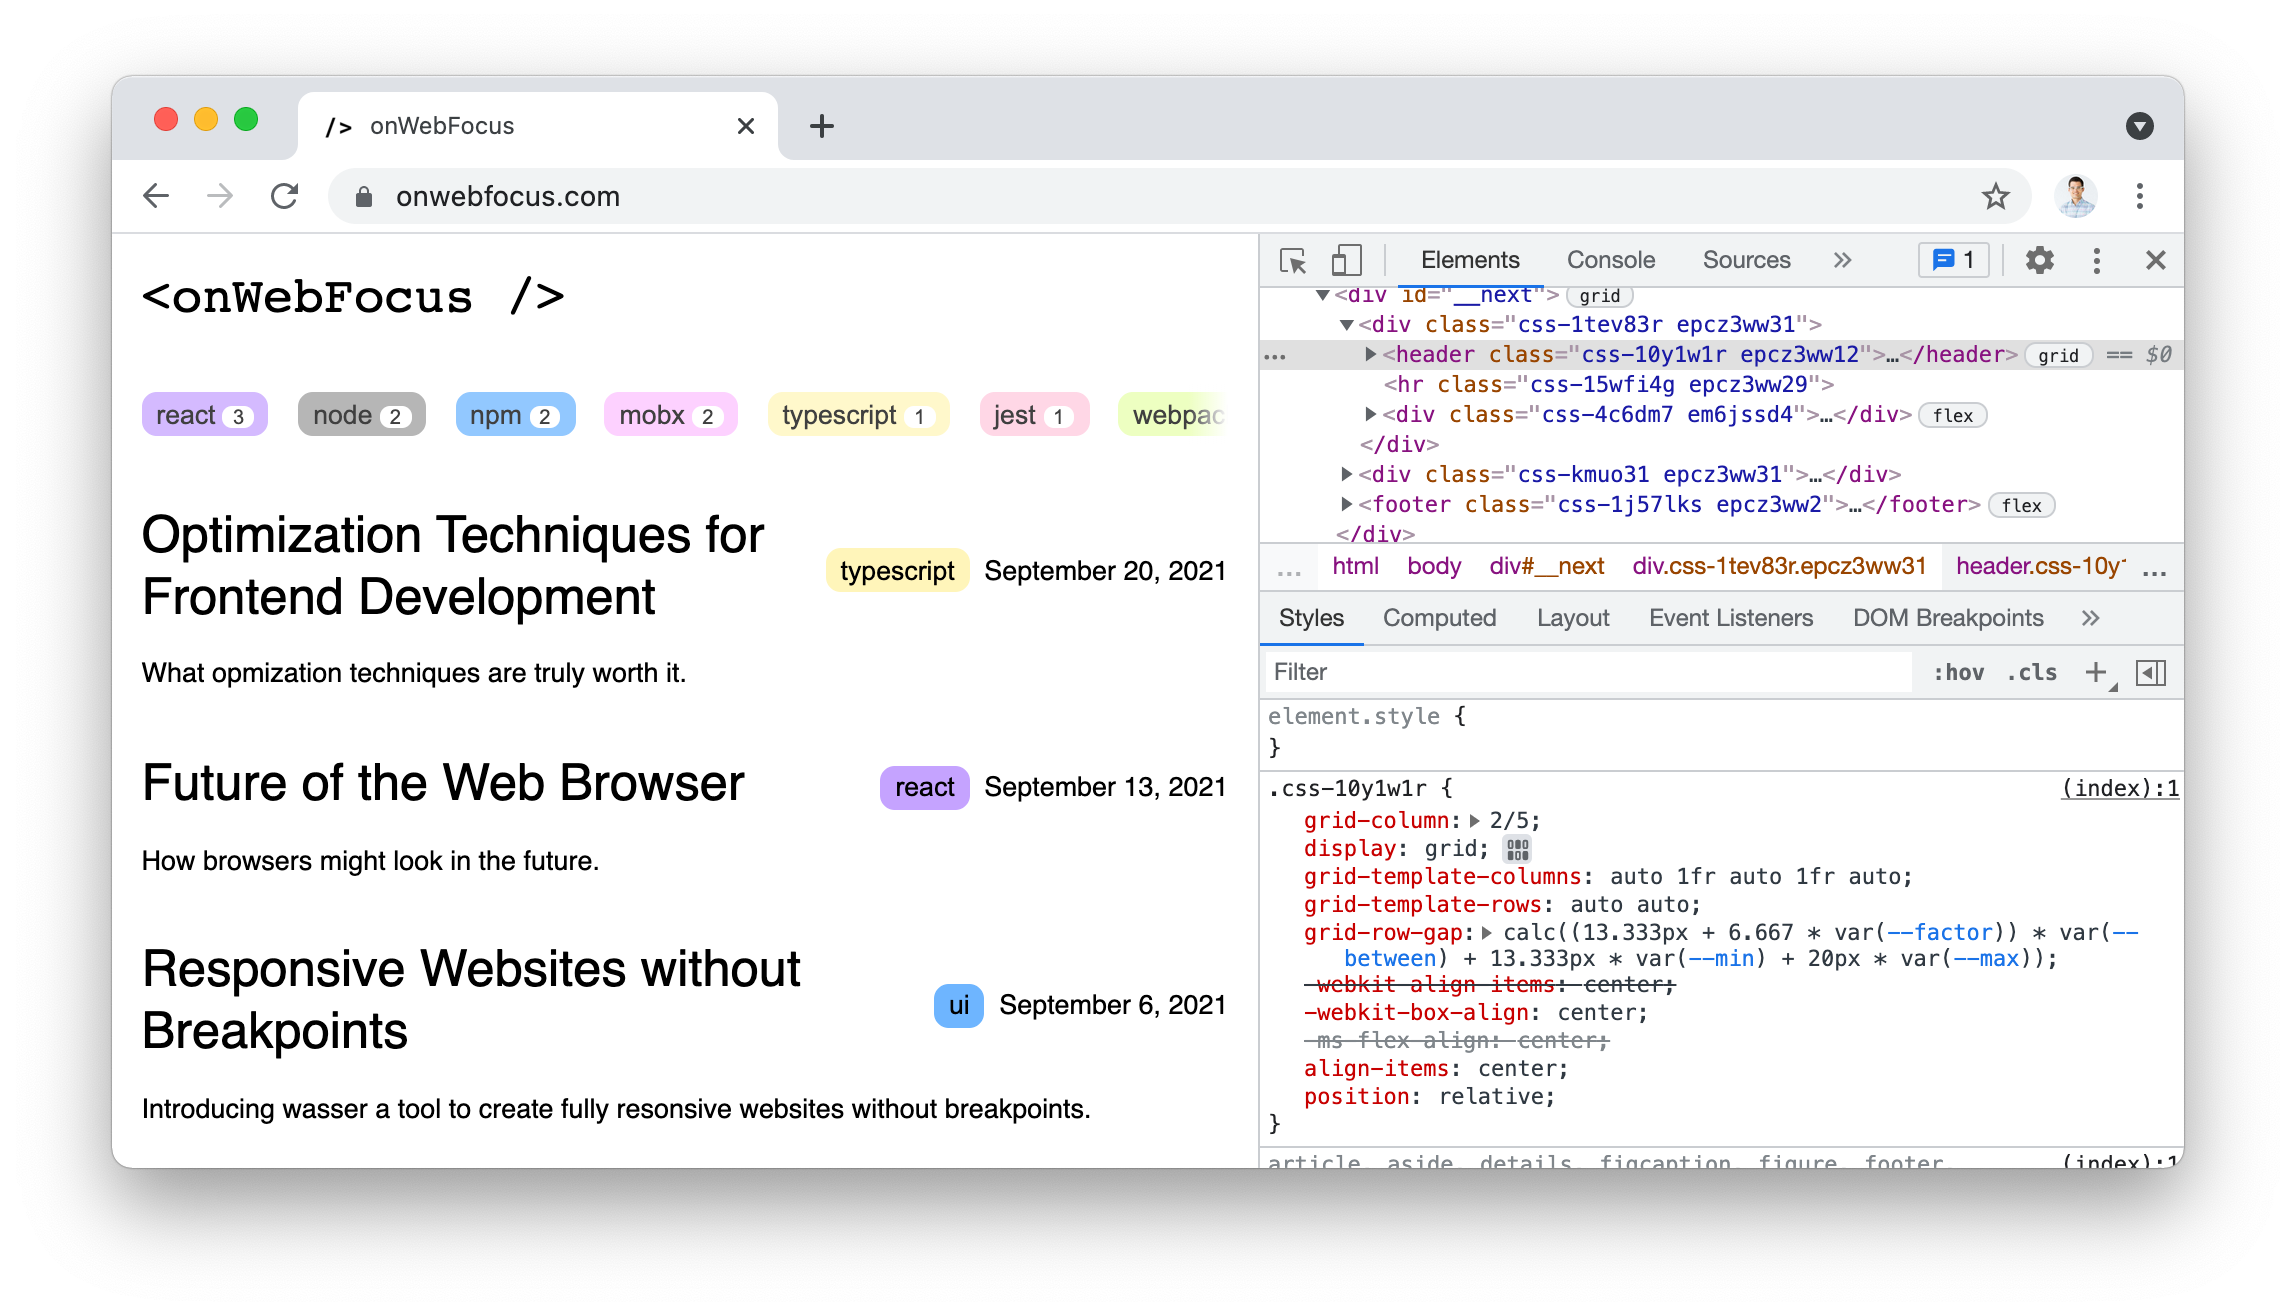
Also very useful are the Developer Tools provided with most browsers. Below you see Chrome with the developer tools open on the right.

The developer tools are the go to when debugging CSS as they allow to inspect the styles for every element and also apply changes in real-time. Developer tools can be extended to inspect properties for certain frameworks like the React Developer Tools for to see the Component tree and inspect props and state values during run-time.
Factors affecting Debugging Performance
Inevitably, when programming you'll run into issues. It's important not to give up altogether as pretty much all problems can be resolved even when it might not seem like it at that moment. Calling it a day and going at it again the next day with a fresh mindset can often do wonders.
Which factors can improve your debugging performance apart from the attitude based ones?
Domain Experience
The same issues often pop up in different places. Therefore, experience with other issues can make it a lot easier to also figure out totally new ones. Similarly, recognizing error messages and already knowing in which cases they show up can make things a lot easier.
Theoretical Knowledge
A lot of libraries rely on implicit standards and conventions which you simply have to know to figure out what's actually going on.
Asynchronous code can be especially hard to debug and understand. Therefore a good understanding of how asynchronous code is executed and the issues arising can avoid long debugging sessions.
Project Size
Larger projects are usually harder to debug as there are much more variables that could have an effect on the issue currently being debugged.
Outdated / Early Adopted Technologies
Working with outdated technologies can cause issues due to missing backwards compatibility of current hardware or browsers. Also, documentation may not be available anymore or harder to find. The same applies to early adopted technologies which often include bugs themselves and don't yet have extensive documentation available.
Steps to best debug an issue
At first you'll only notice that some result isn't showing up as expected. However, this might not tell you very much about what the problem is or where it originates from.
Your first step is to figure out as best as possible where the problem originates from.
Once you know where the problem comes from it's time to think about what might cause the problem. With a possible cause in mind it's time to mitigate the issue and see if the problem is gone.
npm's Most Popular Package
A package called debug has more than double the weekly downloads of the second most popular one. As the name implies it's used for debugging. It doesn't do much more than print console.error statements prefixed with a name defined during instantiation. Unaware of this module I created my own version which is called logua that does pretty much the same thing.
The reason why the debug package is more popular than client-side frameworks like React is that it's used in a way similar to a UI framework. It's popular with all kinds of continuously running applications like servers where it's printing what's going on all the time. In the case of issues this chain of log statements can be used to debug the issue similar to when debugging an issue in the client with console.log statements.